

REPORT OF FINDINGS: DR. MARY BETH FREIDSON SALARY ANALYSIS
1. What is the appropriate standard against which your salary should be compared, in order to assess “equity”?
Based on my understanding of the nature of pay structures in the Department of Sociology, I concluded that four items may be of relevance in assessing how salaries are determined by the University: (1) years of experience at the Red Hills Community College (hereafter Red Hills); (2) total years of faculty experience at all institutions (including both Red Hills and prior employers); (3) current institutional rank (Assistant Professor, Associate Professor, or Professor); and (4) tenure status (tenured or untenured).
In order to assess whether your salary departs from an equitable standard, I first needed to determine the appropriate standard of comparison. To do this, I analyzed relationships between these factors and the salaries of other members of the Sociology Department faculty.
Analysis of each of these factors, in all possible combinations, indicates that rank and tenure are highly interrelated, and thus both are not needed in order to produce an accurate representation of salary.[i] Similarly, there is a strong relationship between years of experience at Red Hills and total years of experience, and thus inclusion of both is duplicative.[ii] Analysis of the best fit models is presented in Table 1. Additionally, you indicated that a promotion to Associate or full Professor increases salary, beginning in that year, by a flat amount.[iii] However, models that adjust for this bonus do not perform better than models that simply assess the impact of rank, and thus such a specification is rejected.[iv]
Table 1 – OLS Linear Regression Models of Faculty Salary in the Sociology Department
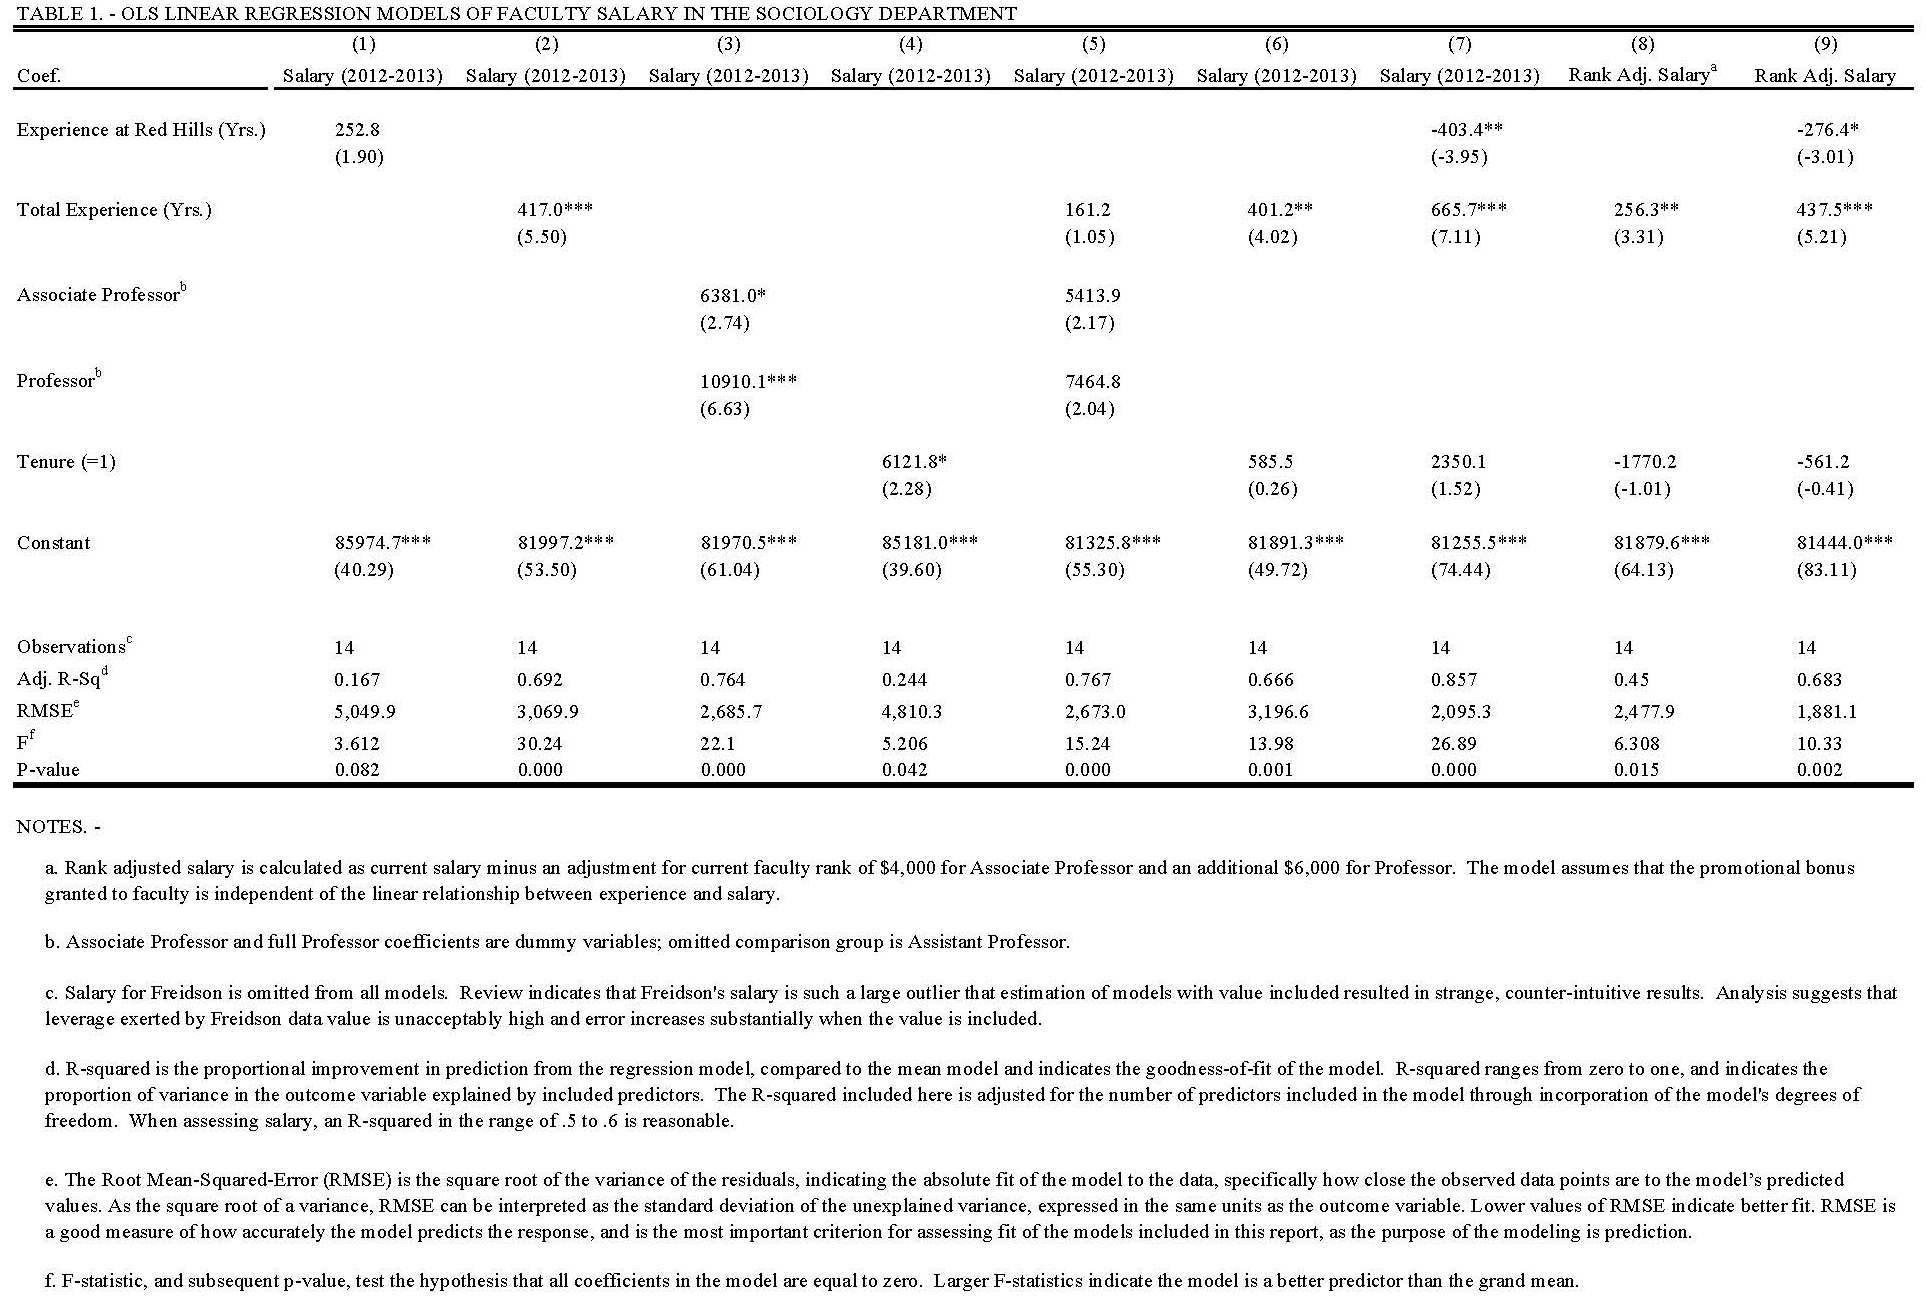
The model that best represented the current salaries of Sociology faculty includes rank and total years of experience.[v] This model accurately represents 77 percent of the data, a very high level, given that wage analysis models which explain 50-60 percent are generally considered to be successful. Therefore, this is the model that will be used going forward.[vi]
Development of this model requires several important assumptions. First, I assume that salaries in the department are generally equitable. While the model controls for some deviation, the assumption will not hold under conditions of racial or gender discrimination, or other circumstances under which department salaries are inequitably distributed. Second, I make the assumption that salaries in the department are determined utilizing the factors discussed. In other words, I assume that the school intends to pay faculty based on experience, rank, and tenure. Again, some variation for unobserved factors (such as research publications or student evaluations of instructor’s course performance) is acceptable without undermining findings. Lastly, I make the assumption that analysis of your salary and those of other Sociology department faculty provides an appropriate comparison. If you differ in substantial ways from your fellow department faculty (for example, you teach special classes, have differential credentials, etc.), then the Sociology faculty would be an inappropriate peer group for comparison.
2. To what extent does your salary deviate from the selected standard?
In a comparison of other Sociology Department salaries to the standard developed above, more than half of the department makes within two thousand dollars ($2,000) of the predicted value. Not counting you, seven professors (46 percent) are undercompensated and six professors (54 percent) are overcompensated.
In contrast, your salary is approximately eleven thousand dollars ($11,000) less than it should be. In determining whether this undercompensation is a sign of inequity, rather than the product of expected variance within a normal distribution, I examined whether your salary met generally accepted criteria for classification as an outlier or statistical aberration.[vii] I conclude that your salary indeed shows signs of being an outlier, and falls significantly below the standard developed above. Table 2 contains outlier analysis and predicted salaries for the three most explanatory models. Predicted salary is the amount you would need to receive in order to fall within the standard.
Table 2 – Modeling Data, Externally Studentized Residuals, and Predicted Outcome for Sociology Faculty
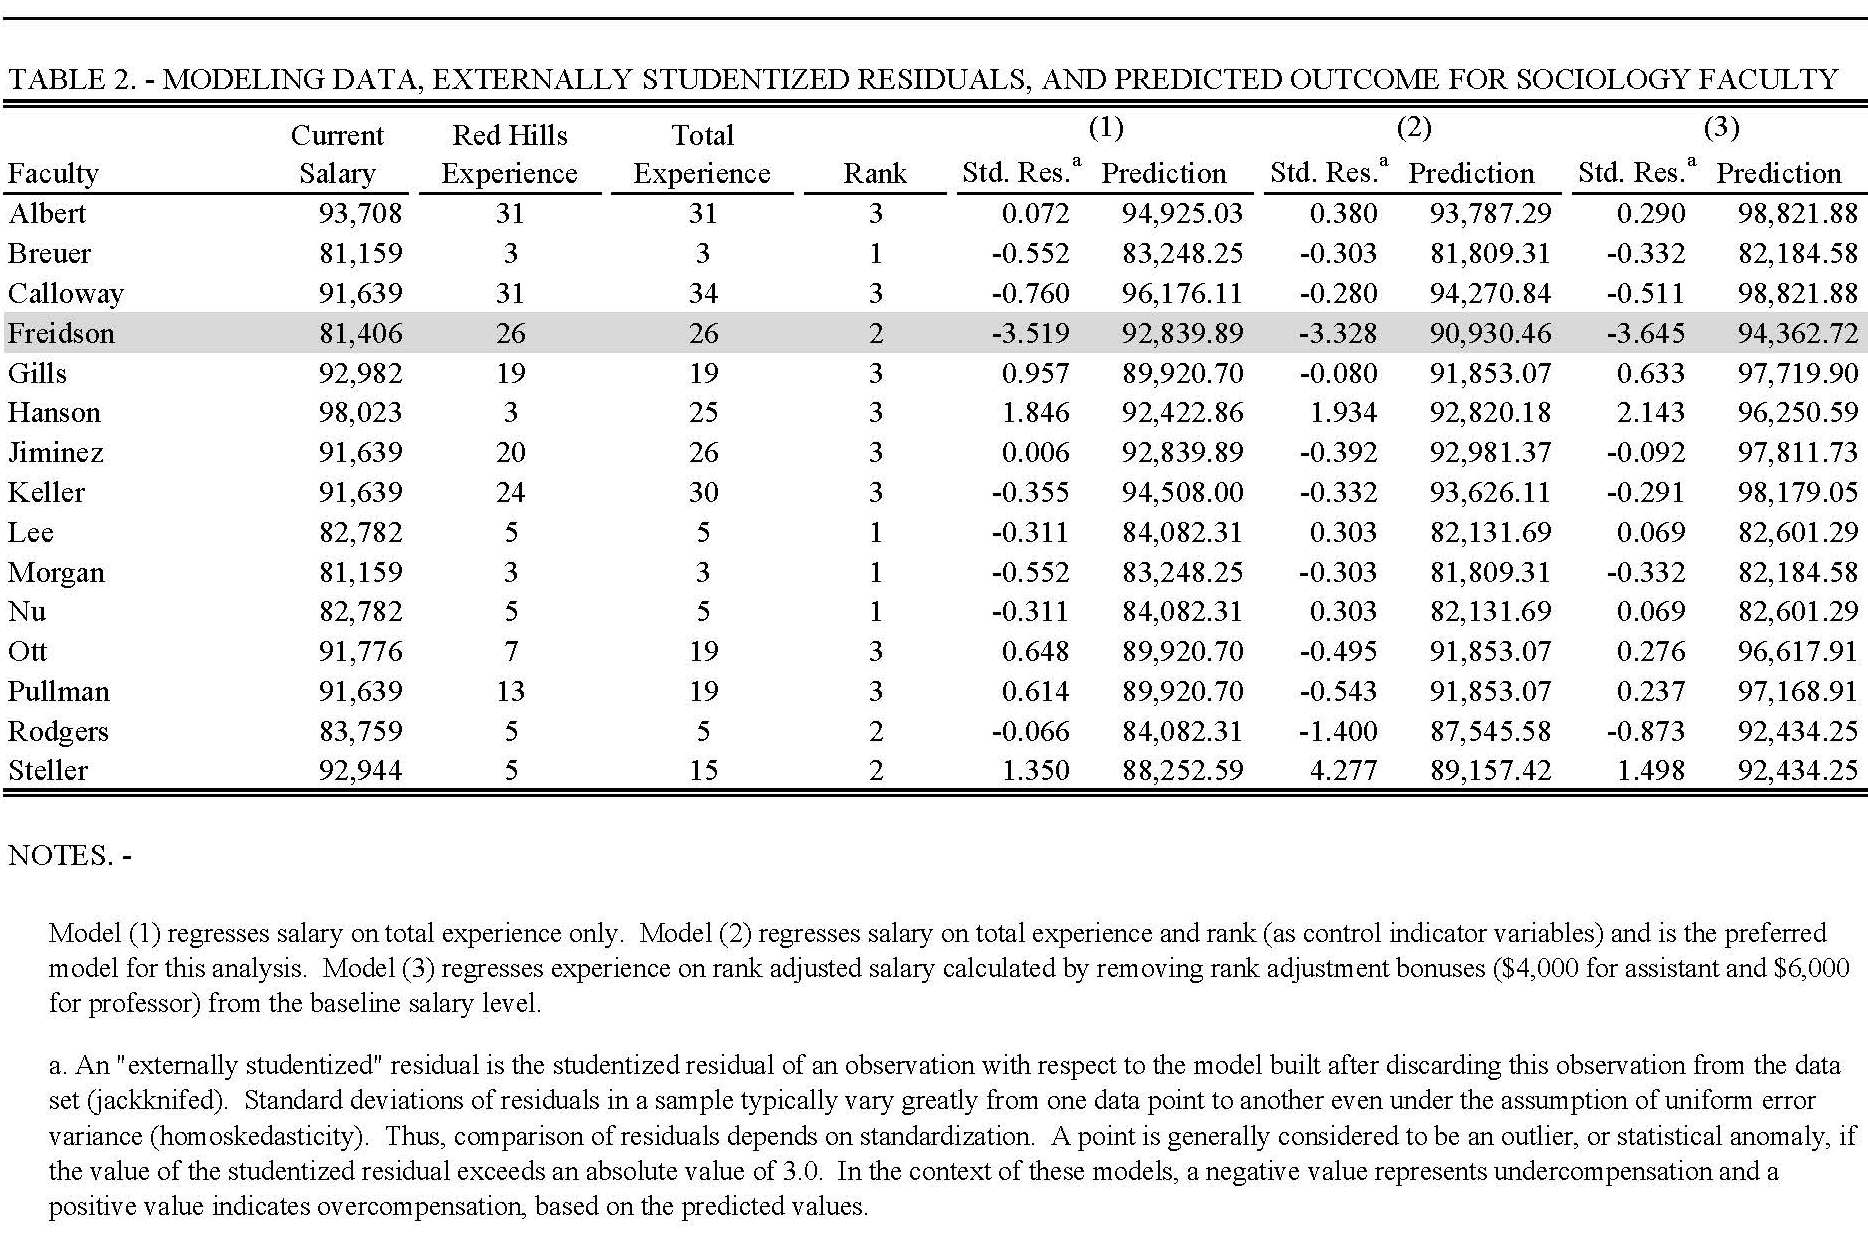
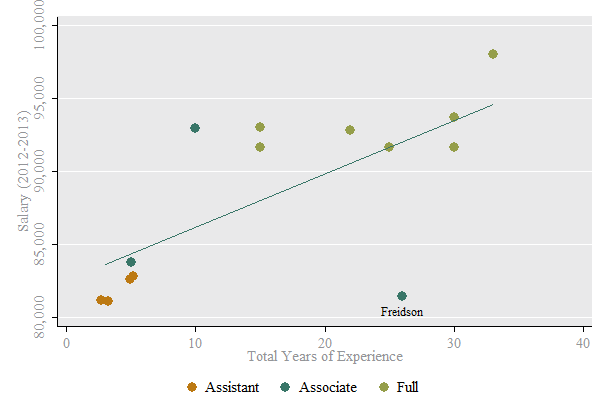
Figure 1 displays all Sociology Department salaries, including your own, and shows their relationship with the standard developed for this analysis, shown as a line. As you can see, most members of the department fall close to the standard, but you fall significantly below it, to the point of being an outlier. In fact, in a normal distribution of salaries, the probability of observing a salary this far below the standard would be less than 0.0001.[viii]
Figure 1 – Relationship between equitability standard and Sociology faculty salaries.
In an equity analysis such as this one, it might normally be possible to include all members of a department in the analysis, and then report on the subject employee’s standing with respect to the projected standard. However, because your salary is so far outside the norm, compared to all of your colleagues, inclusion in the model biases the estimate so far as to generate an overwhelming amount of error and produce meaningless results. As such, the only way to mathematically understand your position within the department is to perform this regression on everyone else, and then describe your position with reference to the standard that comes from analysis of your more normal-salaried cohort.
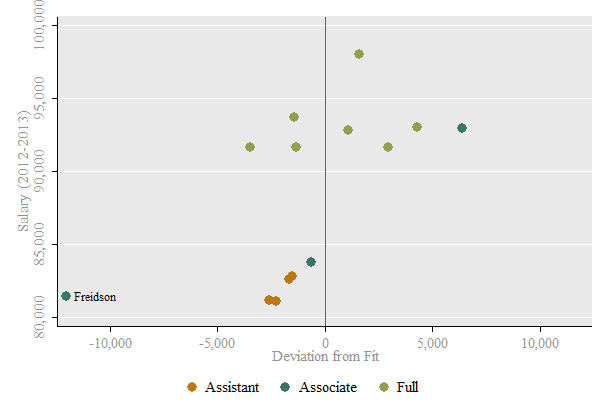
Although this is a statistical conclusion, it can also be easily understood visually – in Figure 1, we can see thirteen faculty members in reasonable proximity to the estimate and one faculty member (you) far outside the pattern. Figure 2 depicts this relationship, showing each faculty member’s position above or below the standard for the department. As you can see, your salary is approximately eleven thousand dollars ($11,000) below the standard and is the most deviated by a substantial margin.
Table 3 presents modeling of the standard developed above and comparison of your salary to the standard. Each model offers a prediction as to what your salary would/should be, and a margin of error as to that prediction. As mentioned above, the model accounts for approximately 77 percent of the data, and thus the margin of error reflects the unknown factors influencing salary that contribute to the unexplained 23 percent of variation. Thus, if you rate very well in the unexplained factors that make up the 23 percent, you would fall at the high end of the range created by the margin of error. Under the best model, the predicted salary range, based on your experience at Red Hills, would be $88,860 to $93,001.
Table 3 – OLS Linear Regression Models and Predicted Salary for Freidson
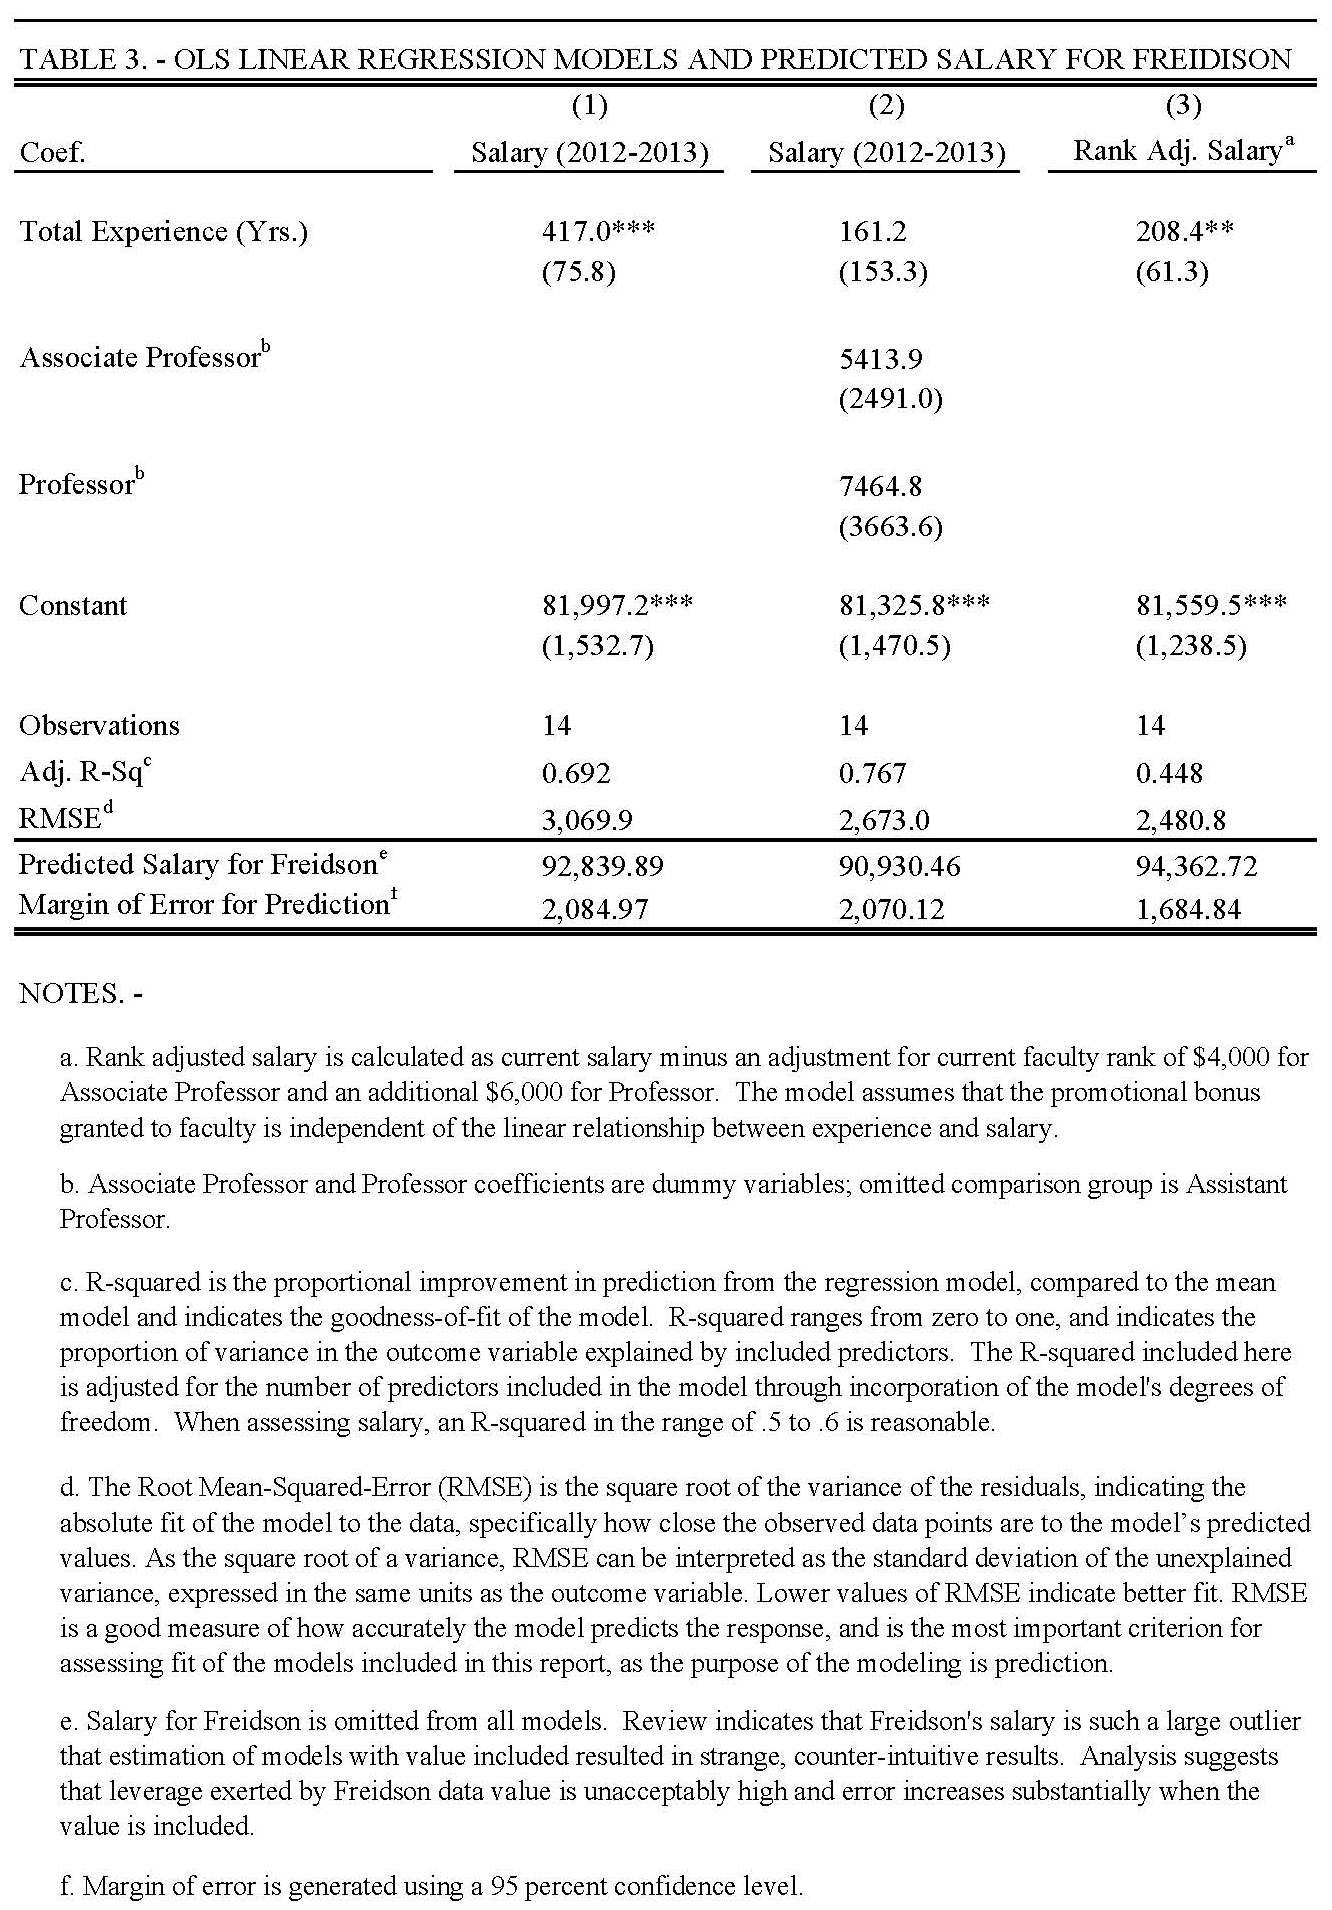
Figure 2 – Distance of Sociology faculty salaries from predicted standard.
NOTE: THIS IS A SAMPLE REPORT – CREATED USING REAL DATA YET A FICTITIOUS PLACE AND PEOPLE

Download full: “Analysis of Salary Equitability”
[i] Inclusion of both rank and tenure reduced significance in all models of this specification. This is not an unexpected result, given that all Associate Professors are untenured but only one Professor is currently untenured. Inclusion of rank reduces error more than inclusion of tenure. Thus, tenure is omitted from all further models.
[ii] Correlation between Red Hills experience and total experience is 0.831. This relationship is not surprising, given that many members of the department have an extensive record of service at the university. Total experience has a more substantive relationship with salary than Red Hills experience. Thus, Red Hills experience is omitted from all further models.
[iii] Currently this amount is $4,000 for promotion to Associate and an additional $6,000 for promotion to Professor.
[iv] In order to address the issue of promotion-linked salary increases, I tested the hypothesis that such increases reduced the linear relationship between salary and experience. I adjusted salary by the promotion bonus amount, to produce an ‘unbonused’ salary level, and this level was used to test the relationship between experience, tenure, and adjusted compensation. The models are rejected as failing to improve explanatory power or goodness-of-fit.
[v] These conclusions hold even when the assumption of normality in the outcome variable is relaxed. Transformations of salary resulted in no increase in goodness-of-fit.
[vi] Adj.R-Sq.=0.767; RMSE=2673.0; F=15.24 (p-value<0.001).
[vii] This analysis is conducted using an externally studentized residual, constructed from model residuals that have been standardized using a jackknife procedure. Residuals with an absolute value greater than 2.5 occur in normally distributed data less than one percent of the time. Residuals with an absolute value greater than 3.0 are considered to be outliers or statistically anomalous. Under different modeling specifications, your studentized residual ranges from -3.328 to -3.645.
[viii] This p-value is based on a left-tailed Z-score distribution calculation.